
Sampling Saturn
(Trying to figure out the advantages/disadvantages of over-sampling in planetary imaging)
In imaging the planets one has to compromise between the contradictory needs of recording the most intricate, diffraction-limited details that your telescope can resolve and of trying to do it all as quickly as possible in order to overcome the mess that seeing conditions (atmospheric turbulence) is thrusting upon you. To be sure that all the diffraction-limited details are recorded, the conventional wisdom is to sample at the Nyquist criterion, critical sampling or at a bit higher magnification. This is generally taken to mean that there should be two or more pixels per FWHM (Full Width at Half Max) of the diffraction disk, though there's differing opinion that it should simply be more than 3 pixels per FWHM. There is nevertheless the nagging suspicion that over-sampling may well yield ever so slightly more subtle detail. This page examines the benefits or otherwise of over-sampling.
What, in any case, is the "diffraction limit"? It is well known that details that join up to form patterns (e.g. a line) are much easier to perceive than an isolated spot. The Cassini Division in Saturn's Rings is an excellent example. Even at its widest, it hardly ever exceeds half an arc-second as seen from Earth, yet it is easily seen in an 8" scope (Rayleigh Diffraction Limit of around 0.6 arc-seconds). It may also be seen in a 4" scope (Rayleigh limit of over 1 arc-second) and some claim to see it in even smaller scopes. So there's something to be said for over-sampling, just in case... It may perhaps be worthwhile here to examine what is meant, exactly, by the "diffraction limit".
Here's the standard Bessel Function cross-section of the diffraction pattern formed by a point (e.g. a star) at the focus of a perfect lens or telescope. The minima and maxima form the so-called Airy rings:
It's important to realize that the diffraction pattern remains the same but the lateral extent varies linearly with wavelength. So, what wavelength should we use to represent "white" light? Visually, in bright illumination, the eye is most sensitive to wavelengths around 0.55 microns (so that's reasonable for bright, planetary images) but in very dim light the eye is most sensitive to around 0.5 microns, but many photographic emulsions peak at even shorter wavelengths. I chose to make the plots here using a wavelength of 0.4859 microns. This just happens to give a diffraction disk that has a FWHM of 10 microns at a focal ratio of f20; nice round figures. All the graphs can be re-scaled on the x-axis very simply for any wavelength, linearly. Just remember that longer wavelengths will make the disk wider and shorter wavelengths will make it narrower. Also, magically ;-) at 0.4859 microns (or 4859 Angstroms) we can have the following very simple relationship:
FWHM (in microns) = N/2
where N is the focal ratio, or f-no.; or focal-length / aperture-diameter, using the same units (be it cm or inches or donkey lengths)
So if you wish to have n pixels, each w microns wide, per FWHM simply use
N = 2nw
i.e. for 2 pixels/FWHM use N = 4w, for 3 pixels/FWHM use N = 6w, etc.
Next let us look at what happens when 2 point sources are brought close together. This is how the diffraction patterns add up when they are 2*FWHM apart:
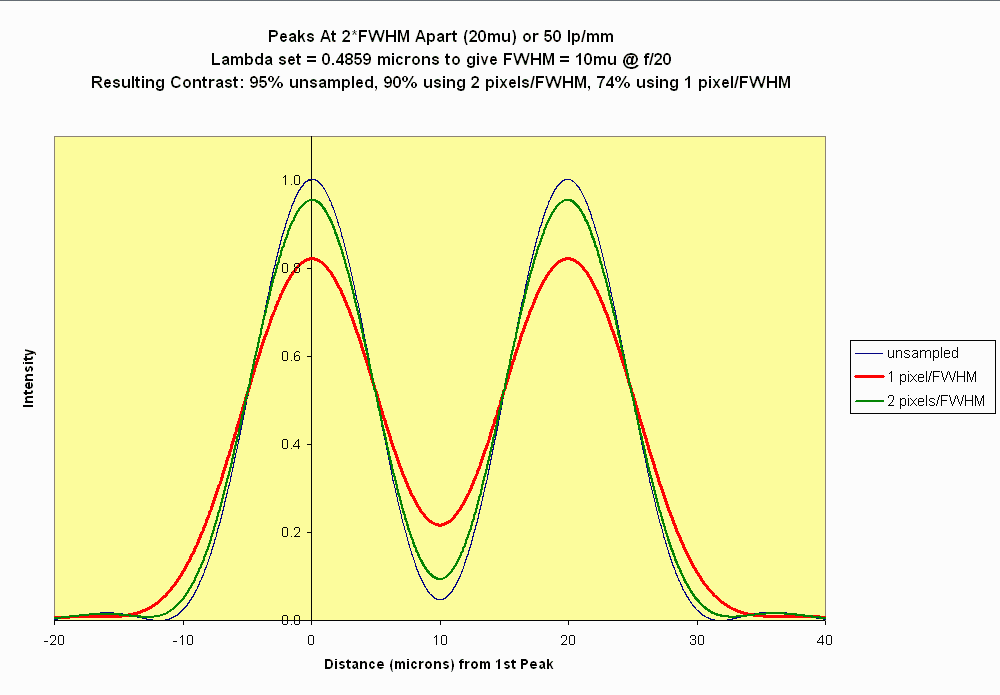
Now we can start looking at what happens when we use finite-sized windows for our sampling. Imagine a window that is 10 microns wide scanning the "unsampled" pattern from left to right (or right to left). You'll obviously get a smearing of the diffraction patterns. A window that scans is a more valid analogy than a fixed window or windows when we later stack images, each frame slightly jiggled with respect to the previous. It becomes immediately obvious that that central minimum (pretend it's the Cassini Division in Saturn's Rings) will have a diminished contrast. The reduction in contrast will be smaller the narrower our sampling window. When we use a window (pixel width) that's half the FWHM we find that the reduction in contrast is actually quite small (from 95% to 90%). So the generally-accepted rule-of-thumb for CCD imaging, two pixels per FWHM looks very reasonable. But is it?
Rayleigh set out to define a "diffraction limit". Eh? Is this the same Sir Walter Rayleigh who courted Queen Elizabeth I and threw his coat into muddy puddles? Anyway, very scientifically he defined his diffraction limit as when two stars are placed close enough together that the peak of the second star is at the first Airy minimum of the first star:
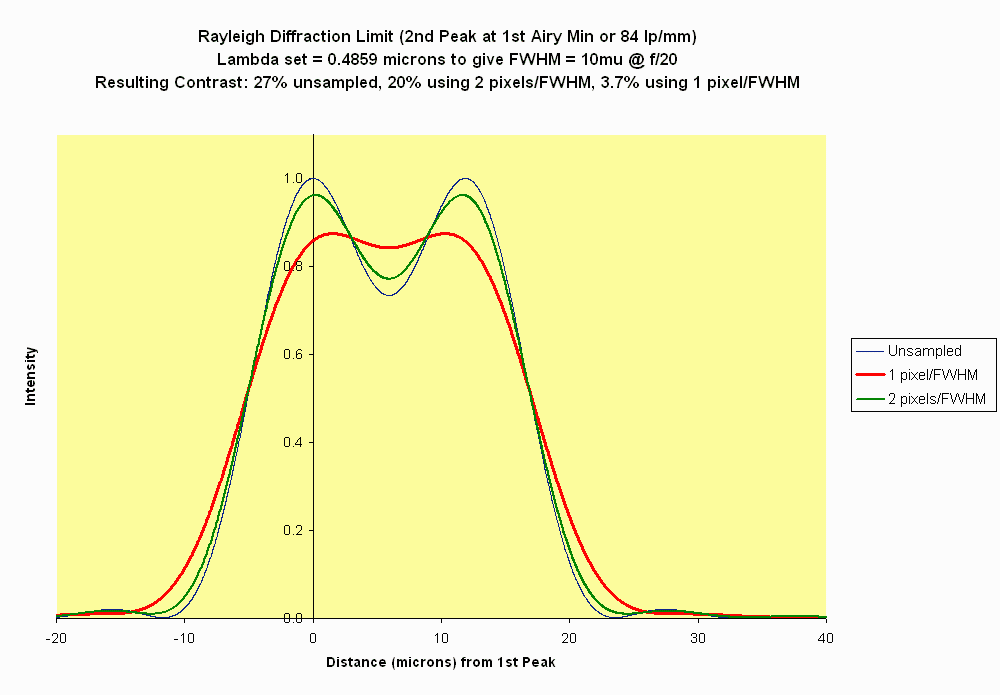
It now becomes very obvious that sampling with one pixel-width per FWHM is very destructive of contrast but that two pixels per FWHM is still very much in the running. Let's get even closer:
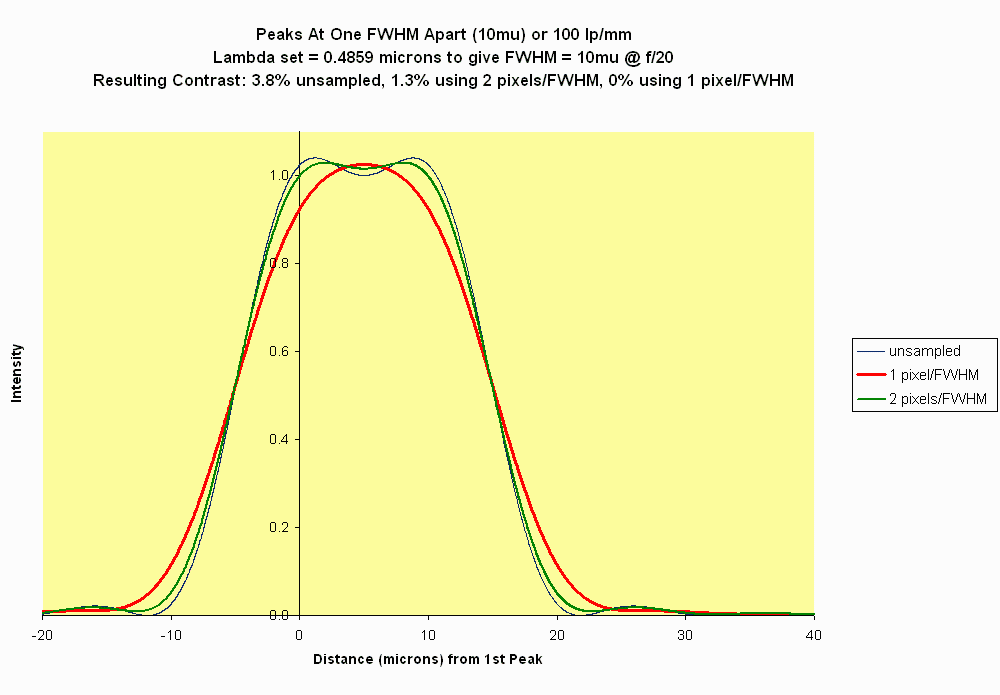
Remember the earlier stuff about the eye seeing details even finer than the Rayleigh Diffraction Limit provided there's a pattern to be perceived? Well, there's a Mr. Dawes who also noted that one can identify stars as double when they too are separated by less than the Rayleigh limit. So he came up with his own Dawes Limit, empirically. Basically he found that provided that there is still some 5% contrast in that central dip between the two diffraction peaks then a good observer can identify a double star. So the Dawes Limit is somewhere between Rayleigh's and the above FWHM separation. Now, if the eye of a well-trained visual observer can perceive a 5% contrast, how much lower contrast can a CCD go, especially if there is a pattern (infamous canali on Mars or splits in Saturn's Rings). I tried to find out by imaging Saturn at approximately 2 pixels/FWHM and 4.5 pixels/FWHM (determined by calibration against The Sky software). Capture was with a Philips ToUcam Pro webcam (5.6 micron square pixels) on an 8" SCT using a 2x Celestron Ultima Barlow and a 5x Televue Powermate. Below are the results, resized and mixed up. Each image shown below is a stack of the best 25% from a 5fps video sequence either 200 or 300 frames long. Some are at 2 pixels/FWHM and others are at 4.5 pixels/FWHM. Can you identify which are at which magnification? Do try before reading further ;-)

Hints: Both series had the same, rather long exposure per frame (1/25th second nominally in the control software, but believed closer to 1/5th second in reality) so seeing is an issue in both series, but the gain had to be jacked up a lot for the much dimmer, higher magnification. At high gain it looks as if the webcam starts behaving like a high ISO photographic emulsion, in the sense that tonality and colour rendition are not as good as at lower gain. Check out the Enke Minimum and the Crepe Ring. One would expect the 4.5 pixels/FWHM series to also appear sharper, but more noisy. Done your identification? Click here for the answer.